Multi-Scale Carbon Integrated Research and Visualization Platform
多尺度碳综合研究与可视平台
Introduction
Our team is developing the Multi-Scale Carbon Integrated Visualization Platform, which is an important outcome of the Shanghai 2022 "Technology Innovation Action Plan" under the science and technology support for carbon peaking and carbon neutrality projects. It plays a central role in Topic of the "Research and Demonstration on Dynamic Urban Planning Design under the Dual Carbon Background in Mega Cities." The platform systematically constructs a multi-scale greenhouse gas emission inventory framework and innovatively introduces the "Land Use Classification - Accounting Department - IPCC" translation framework. By integrating the "Land Use - Model Method - IPCC" correlation analysis approach, it accurately maps international carbon emission calculation standards to the urban land use level. This process defines the accounting scope and boundaries of carbon emissions, ensuring close alignment and consistency with territorial spatial planning.
团队正在开发完善的多尺度碳综合展示平台,是上海市2022年度“科技创新行动计划”中科技支撑碳达峰碳中和专项项目的一项重要成果,尤其在“双碳背景下超大城市环境动态规划设计研究及示范”课题中占据了核心地位。该平台通过系统构建多尺度的温室气体排放清单体系,创新性地引入了“用地分类-核算部门-IPCC”的转译框架,并结合“土地利用-模型方法-IPCC”的关联分析路径,将国际碳排放计算标准精确地映射至城市用地层面。此过程明确了碳排放的核算范围与边界,确保了与国土空间规划的紧密衔接与一致性。
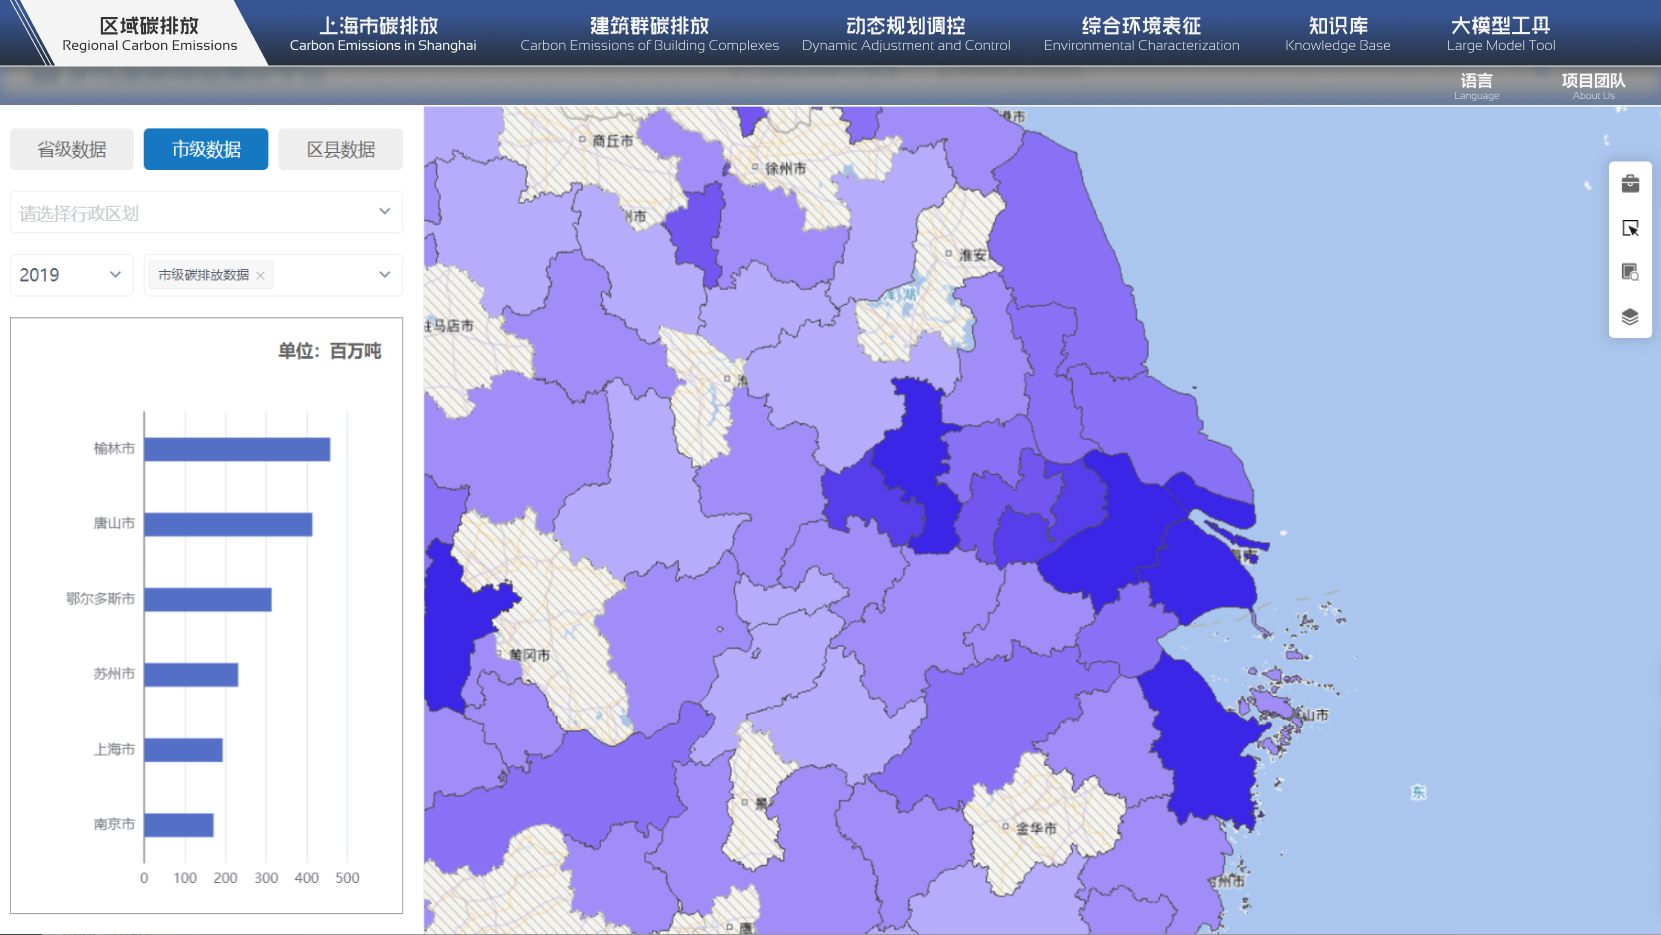
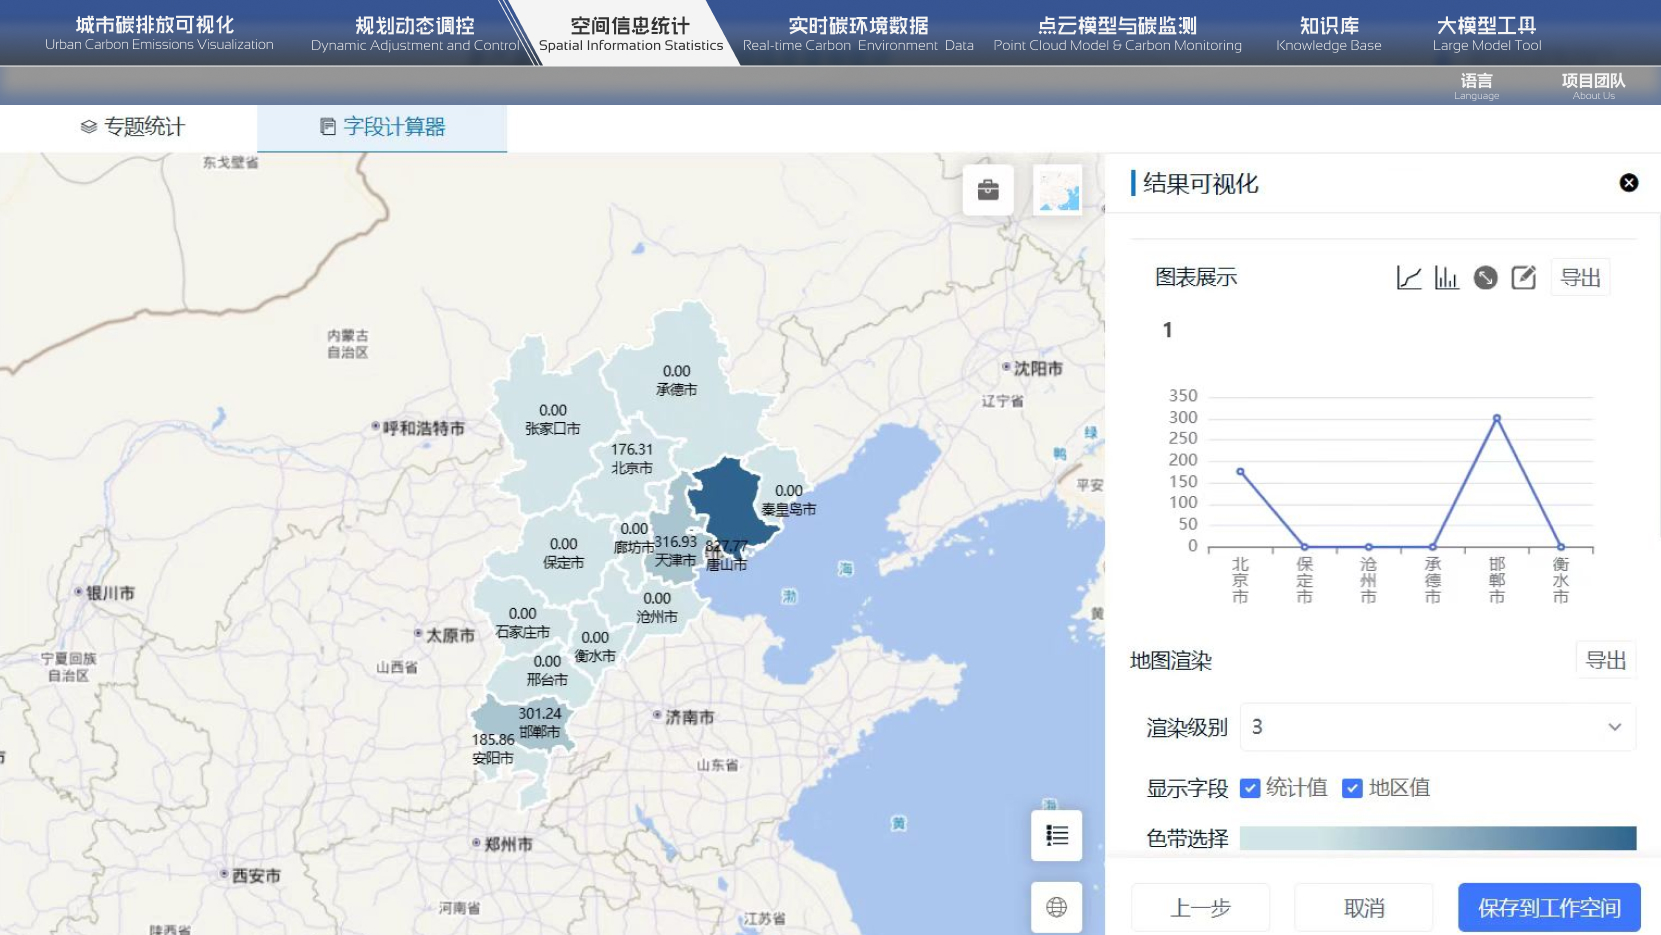
The platform not only has the capability to visually display provincial and municipal carbon emission data but can also flexibly calculate and aggregate carbon-related data based on specific topics and fields. It presents the multi-scale carbon emission status in an intuitive map form. This feature provides strong support for a deeper understanding of the spatial distribution and dynamic changes of urban carbon emissions.
该平台不仅具备对省级、市级碳排放数据进行可视化展示的能力,还能根据特定的专题和字段,灵活地计算、统计各项碳排放相关数据,并以地图形式直观地展现多尺度的碳排放状况。这一特性为深入理解城市碳排放的空间分布和动态变化提供了有力支持。
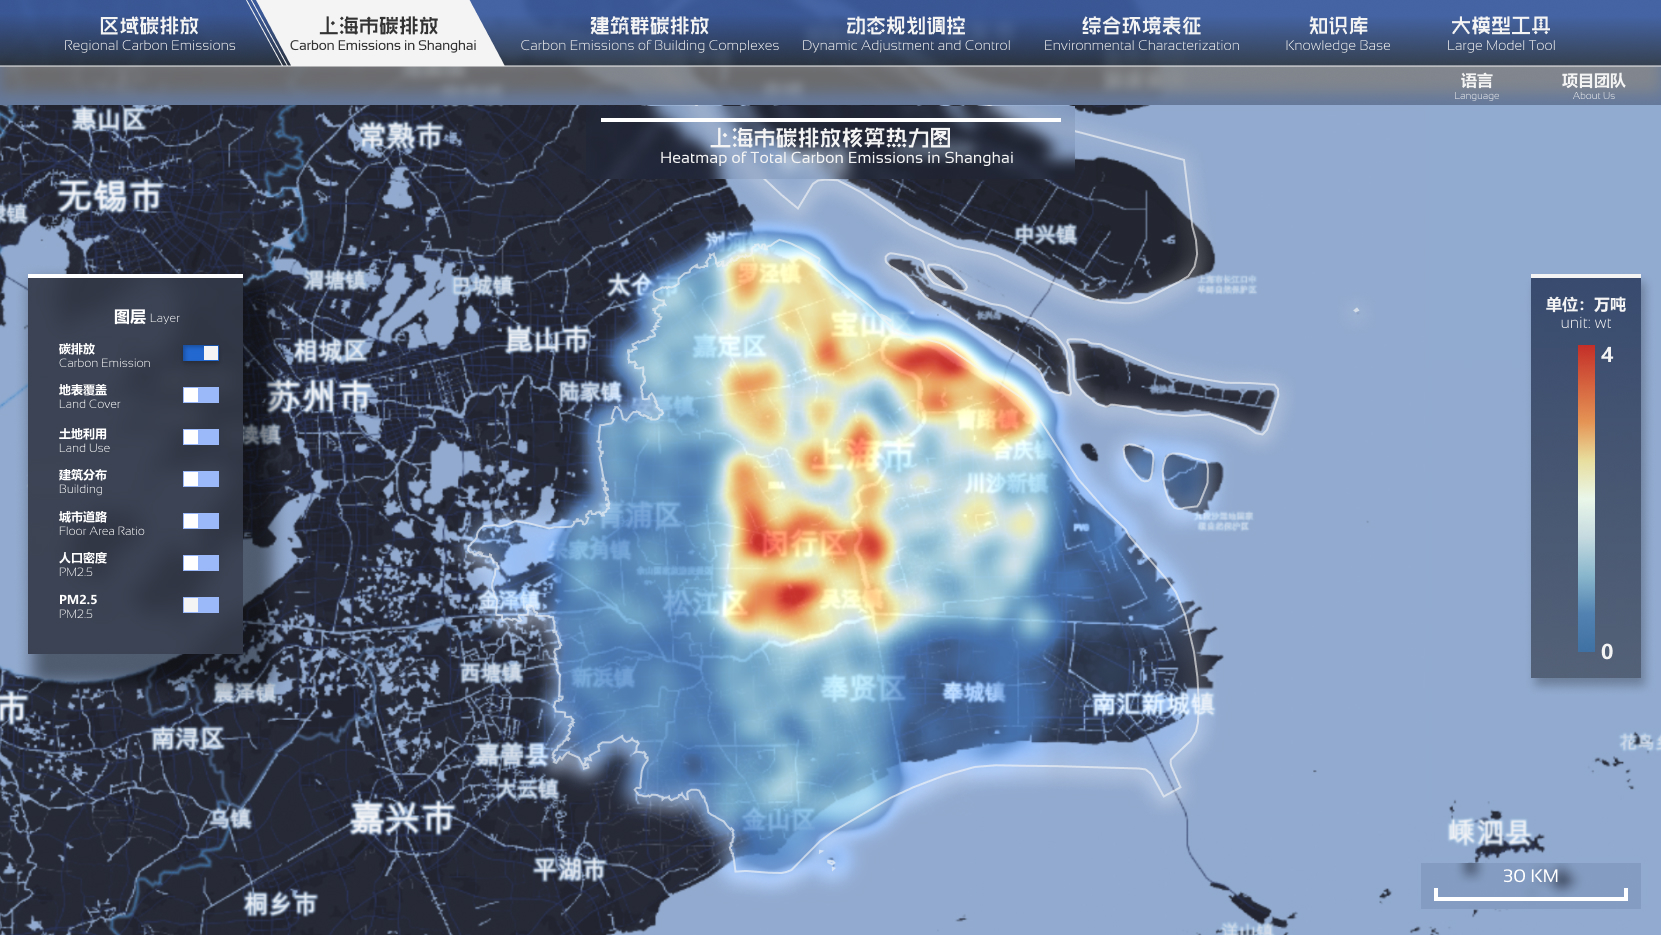
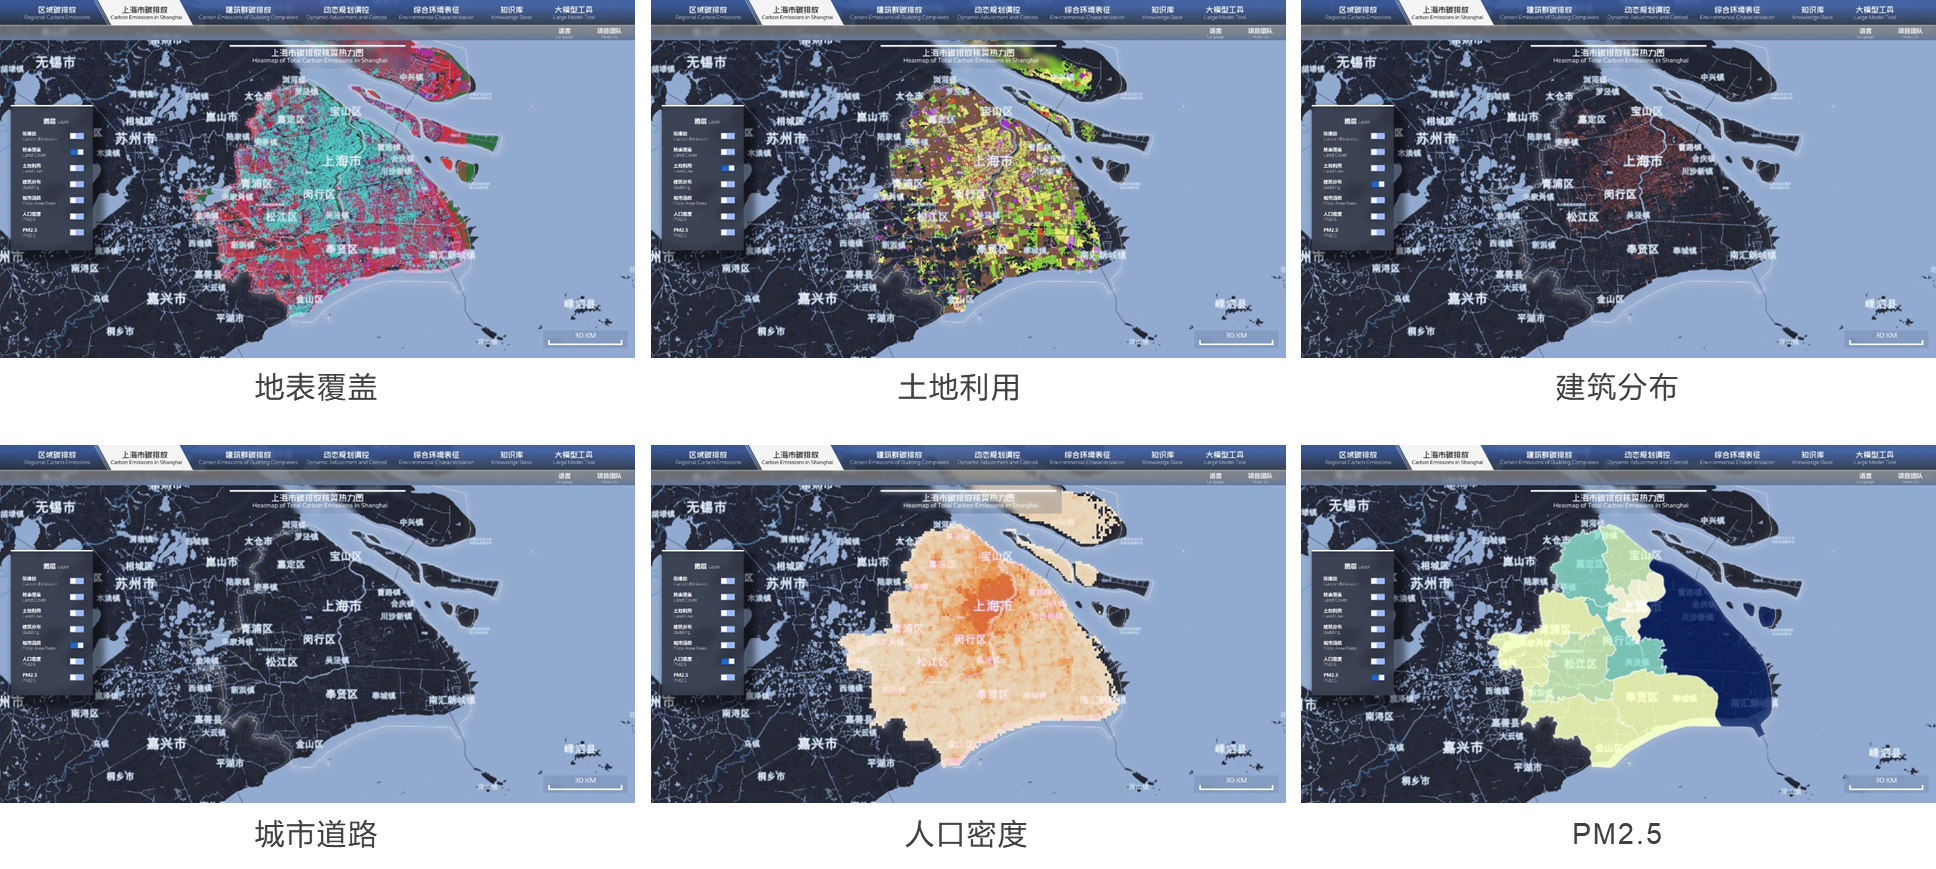
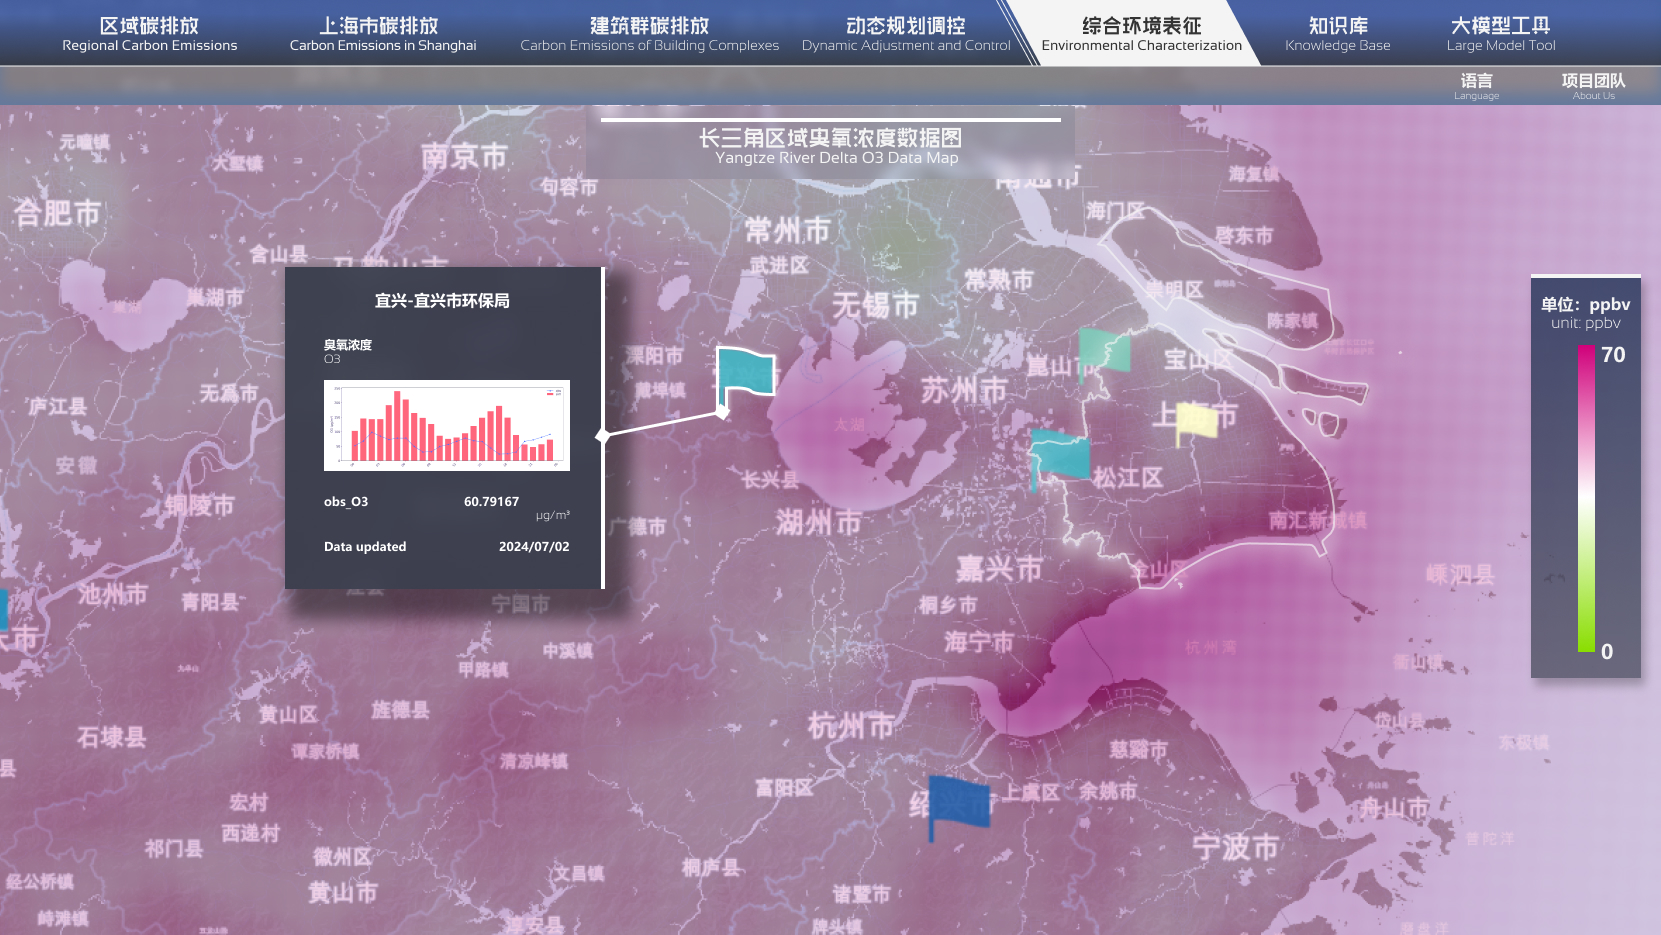
Additionally, the Platform integrates multiple functions, including real-time carbon environmental data display, data visualization applications, and dynamic planning control. Users can access high-precision carbon environmental data, such as meteorological and pollution data, in real-time and use the platform's various data layers (e.g., land cover, land use, building distribution, urban roads, population density, PM2.5, etc.) to comprehensively and deeply understand urban environmental changes and carbon emission scenarios.
此外,多尺度碳综合展示平台还集成了实时碳环境数据展示、数据可视化应用以及规划动态调控等多重功能于一体。用户可以通过该平台实时获取气象、污染等各类高精度碳环境数据,并利用平台提供的多种数据图层(如地表覆盖、土地利用、建筑分布、城市道路、人口密度、PM2.5等),全面、深入地了解城市环境变化与碳排放情景。
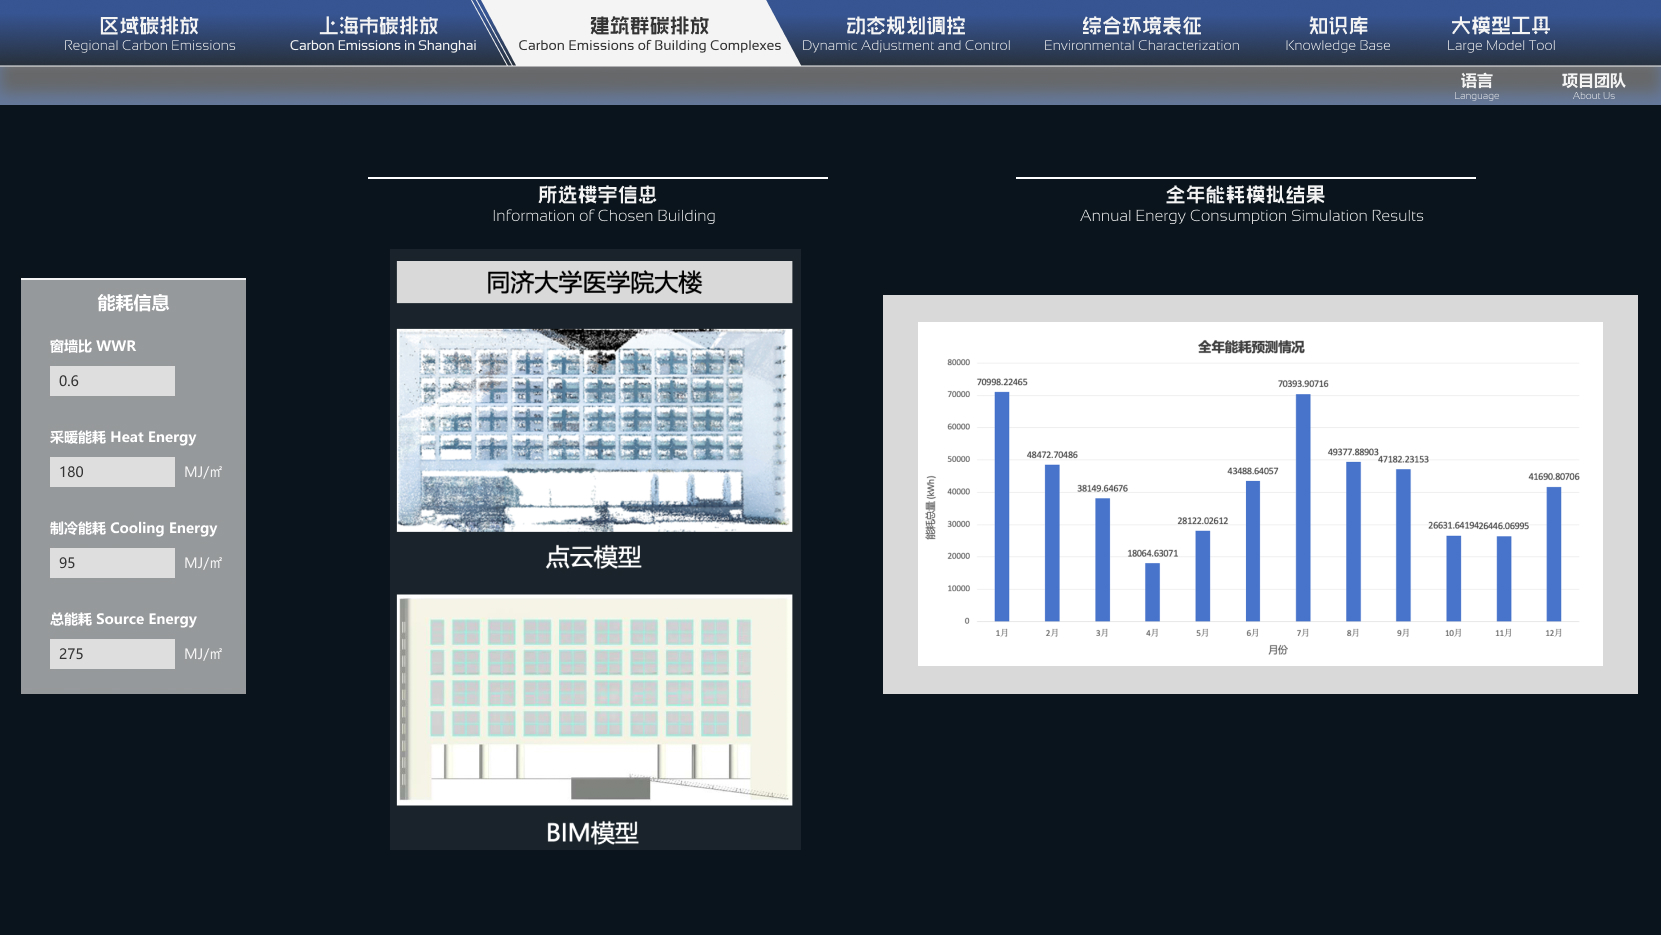
The Lingang Dishui Lake Area Low-Carbon Planning Control Platform, as a demonstration area for this project, utilizes building point cloud and carbon monitoring technology, combined with AI knowledge bases and large model tools, to achieve precise monitoring and intelligent analysis of individual building energy consumption. This practice not only validates the effectiveness and practicality of the Multi-Scale Carbon Comprehensive Visualization Platform but also provides new ideas and paths for the practice and application of urban low-carbon development.
临港滴水湖片区低碳规划调控平台作为该项目的示范片区,通过运用建筑点云与碳监测技术,结合AI知识库和大模型工具,实现了对单体建筑能耗的精准监测与智能分析。这一实践不仅验证了多尺度碳综合展示平台的有效性和实用性,也为城市低碳发展的实践与应用提供了新的思路和路径。